Rat GLP-2 ELISA Assay

$1,120.00

This Eagle Biosciences Rat GLP-2 ELISA Assay kit is used for quantitative determination of rat GLP-2 in serum or plasma samples. The kit is characterized for sensitive quantification, high specificity and no influences with other components in samples. Rat GLP-2 standard is highly purified synthetic product.   The Eagle Biosciences Rat GLP-2 ELISA Assay is for Research Use Only and should not be used for therapeutic procedures.

Rat GLP-2 ELISA Assay

The Rat GLP-2 ELISA Assay is For Research Use Only

Size: 1×96 wells
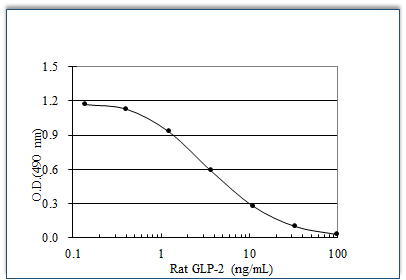
Dynamic Range: 0.137 – 100 ng/mL
Incubation Time: 20 hours
Sample Type: Rat Serum, Plasma
Sample Size: 25 µL
Alternative Name: Glucagon-like Peptide 2, Rodent GLP-2

Specificity: This Rat GLP-2 ELISA Assay kit has high specificity to rat GLP-2 and shows no cross reactivity with rat glucagon and rat GLP-1 even in the concentration of 300 pmol/mL.


Assay Principle

This Rat GLP-2 ELISA for determination of rat GLP-2 in serum or plasma samples is based on a competitive enzyme immunoassay using combination of highly specific antibody to rat GLP-2 and biotin-avidin affinity system. The 96-wells plate is coated with goat anti rabbit IgG antibody. Rat GLP-2 standard or samples, labeled antigen and anti-rat GLP-2 polyclonal antibody are added to the wells for competitive immunoreaction. After incubation and plate washing, HRP labeled streptoavidin (SA-HRP) are added to form HRP labeled streptoavidin-biotinylated rat GLP-2-antibody complex on the surface of the wells. Finally, HRP enzyme activity is determined by o-Phenylenediamine dihydrochloride (OPD) and the concentration of rat GLP-2 is calculated.


Related Products

Mouse GLP-2 ELISA Assay Kit
Human GLP-2 ELISA Assay Kit
Rat GIP Active ELISA Assay Kit

Additional Information

Assay Background


The proglucagon gene is expressed in both pancreatic A cell and intestinal L cell. Tissue-specific posttranslational processing of proglucagon by the prohormone convertase produced the different proglucagon derived peptides (PGDPs) in both pancreas and intestine. The most notable pancreatic PGDP is glucagon, whereas the L cell produces several structurally related peptides, including glucagon-like peptide 1 (GLP-1) and GLP-2, as well as glicentin and oxyntomodulin, which contain glucagon sequence in their molecules. Among PGDPs, GLP-2 has recently been found to show intestinal epithelial proliferation.

Assay Procedure


  1. Bring all the reagents and samples return to the room temperature before beginning the test.
  2. Fill 75uL of labeled antigen solution into the wells first, then introduce 25uL of each standard solutions (0, 0.137, 0.412, 1.235, 3.704, 11.11, 33,33, 100 ng/mL) or samples and finally add 50uL of Rat GLP-2 antibody into the wells.
  3. Cover the plate with adhesive foil and incubate it at 4ºC for 16-18 hours. (Still, plate shaker not need)
  4. Take off the adhesive foil, aspirate the solution in the wells and wash the wells 3 times with approximately 0.35 mL/well of washing solution.
  5. Finally, invert the plate and tap it onto an absorbent surface, such as paper toweling, to ensure blotting free of most residual washing solution.
  6. Pipette 100uL of SA-HRP solution into the wells.
  7. Cover the plate with adhesive foil and incubate it at room temperature (20-30ºC) for 1 hour.
  8. During the incubation, the plate should be shake with a plate shaker.
  9. Take off the adhesive foil, aspirate and wash the wells 5 times with approximately 0.35 mL/well of washing solution. Finally, invert the plate and tap it onto an absorbent surface, such as paper toweling, to ensure blotting free of most residual washing solution.
  10. Resolve one OPD tablet with 12 mL of substrate buffer. It should be prepared immediately before use.
  11. Add 100uL of substrate solution into the wells, cover the plate with adhesive foil and incubate it for 30 minutes at room temperature.
  12. Add 100uL of stopping solution into the wells to stop color reaction.
  13. Read the optical absorbance of the wells at 490 nm. Calculate mean absorbance values of wells containing standards and plot a standard curve on semilogarithmic graph paper (abscissa: concentration of standard; ordinate: absorbance values). Use the standard curve to read rat GLP-2 concentrations in samples from the corresponding absorbance values.

Typical Standard Curve


Rat GLP-2 ELISA Assay

Manual

Product Manual


Product Citations